BANA6043: Grouping Data in SAS
Matt Risley
Week 3 Lecture Series
1 Introduction
Using the diamonds dataset, this applied lecture demonstrates methods to subset–or group–your data. Subsetting data is also be referred to as segmenting or stratifying data. Stratification is a common data analysis technique. It allows you to understand the way relationships among variables may differ within your population.
The lecture introduces a number of common SAS techniques:
- BY-group processing, which allows you to group your data
- PROC SORT, which sorts your data for BY-group processing
- PROC FORMAT, which allows you to control the display of your data in output
- IF/THEN/ELSE logic in a DATA step
This lecture also introduces other useful techniques, including:
- PROC HPBIN in order to segment data (called binning)
- more uses of PROC SGPLOT
- PROC SGPANEL in order to produce panel displays of data
- a WHERE statement, which allows you to subset the data
2 PROC HPBIN
This “High-Performance” (HP) procedure can create categories for continuous data. A binning process allows you to explore relationships within a subset of data. With PROC HPBIN, the SAS user can request more complex methods to segment the data, including weight of evidence (WOE) and information value (IV). These processes use calculations to determine the selection of bins that promote granularity while still containing meaningful information.
Outside of these more sophisticated methods, PROC HPBIN can also cut data with two relatively common methods: (1) bucket and (2) quantile.
2.1 binning with the bucket option
This binning method cuts data uniformly. Imagine you have credit scores in the data ranging from 700 to 800. A bucket binning procedure with 2 bins would cut the data along the midpoint: (a) credit scores 700 to 750 and (b) credit scores 750 to 800. A bucket method with 4 bins would cut the data from 700-725, 725-750, 750-775, and 775-800.
In essence, the bucket method computes equal intervals for a variable’s range.
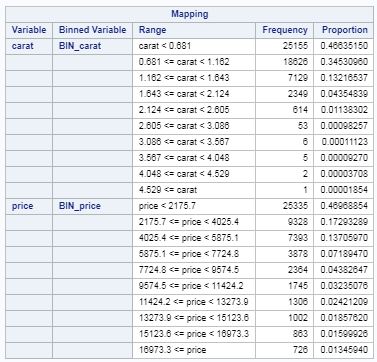
proc hpbin data=mrrlib.diamonds numbin=10 bucket;
     input carat price;
run;numbinoption specifies the number of bins for the procedureinput carat price;tells SAS to perform the operation for variables carat and price
2.2 binning with the quantile option
A more sophisticated method, called quantile, will find breakpoints that each contain a certain percentage of data. For example, the quantile method with 2 bins would cut the data along the median such that 50% of the data are contained in the first bin and 50% in the second. This method approximates the quantiles, so each bin does not contain the same exact amount of observations, but it is close.
proc hpbin data=mrrlib.diamonds output=out numbin=5 quantile;
     input carat price;
     id carat price;
run;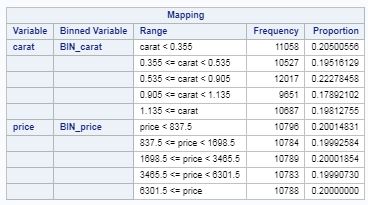
output=outcreates a temporary dataset called outid carat price;tells SAS to also include the variables carat and price in addition to the bin information
The code below shows the first 20 observations of the dataset out.
proc print data=out(obs=20); run;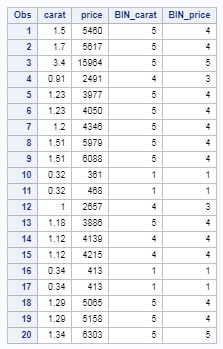
3 Boxplots with SGPLOT
You can create boxplots in SAS with PROC SGPLOT that are horizontal or vertical. Horizontal boxplots use the HBOX statement and vertical use the VBOX statement. The VBOX statement SAS documentation.
Boxplots are a great way to visualize data because they include a great deal of information, including: 1. mean 2. median 3. 25th and 75th percentiles 4. minimum and maximum 5. outliers
The code below creates 5 box plots of price for each carat bin created above.
ods graphics on;
proc sgplot data=out;
    vbox price / group=BIN_carat;
run;
ods graphics off;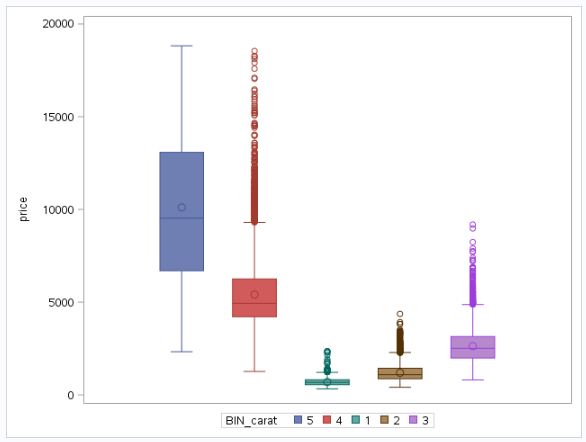
3.1 with PROC SORT
Unfortunately, the graph doesn’t order the bins by default. We can accomplish this through a PROC SORT.
proc sort data=out;
    by BIN_carat;
run;

ods graphics on;
proc sgplot data=out;
    vbox price / group=BIN_carat;
run;
ods graphics off;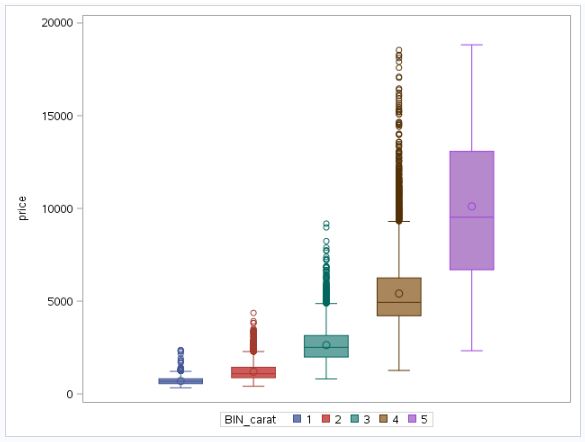
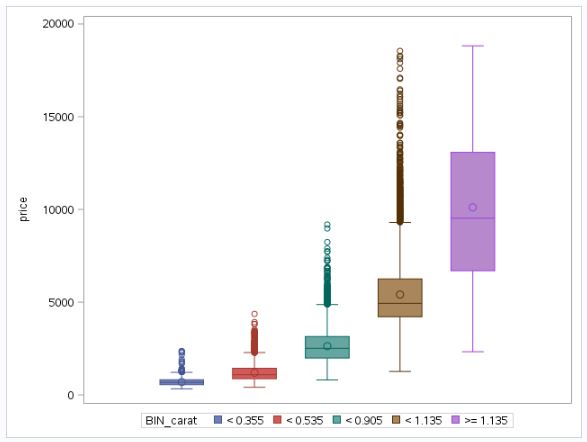
3.2 with PROC FORMAT
Finally, we can add labels to the bin number to provide more information. A PROC FORMAT is a very logical way to accomplish this in SAS.
PROC FORMAT is a procedure that creates a format for the output display of one or more variables. Here is the SAS documentation.
proc format;
    value carat_format   1='< 0.355'
                         2='< 0.535'
                         3='< 0.905'
                         4='< 1.135'
                         5='>= 1.135';
run;
PROC FORMAT uses the value statement. It then takes a variable name for a format. At this point, it is not applied to an actual variable in a dataset. It is just a sequence of logic for formatting.
In this example: 1. We create a numeric format called carat_format. If it were a character format, we’d place a dollar sign ( $ ) in front of the variable name. 2. The logic for the format follows the format name. When the value is one, it will display as ‘< 0.355’, when it is 2, it will display as ‘< 0.535’, etc.
We then call this created format through a FORMAT statement in the PROC SGPLOT:
ods graphics on;
proc sgplot data=out;
    vbox price / group=BIN_carat;
    format BIN_carat carat_format.;
run;
ods graphics off;
In the format statement, we tell SAS to format the variable BIN_carat with the format carat_format. Note that formats use a period to designate them as formats.
4 Histograms with SGPLOT and SGPANEL
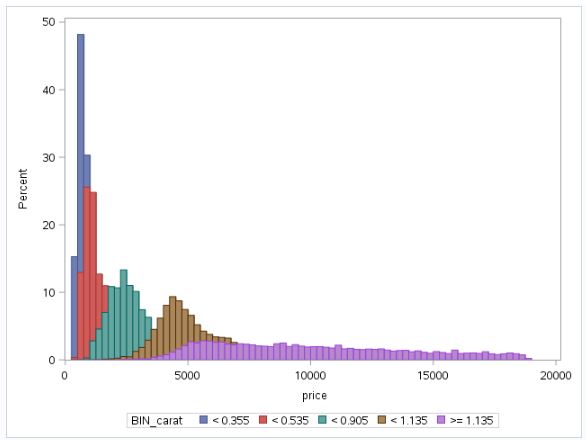
First, let’s just produce a single histogram with the bins we created.
ods graphics on;
proc sgplot data=out;
    histogram price / group=BIN_carat;
    format BIN_carat carat_format.;
run;
ods graphics off;
Everything about this code is equivalent to the last code chunk, except that we replace a VBOX statement with a HISTOGRAM statement.
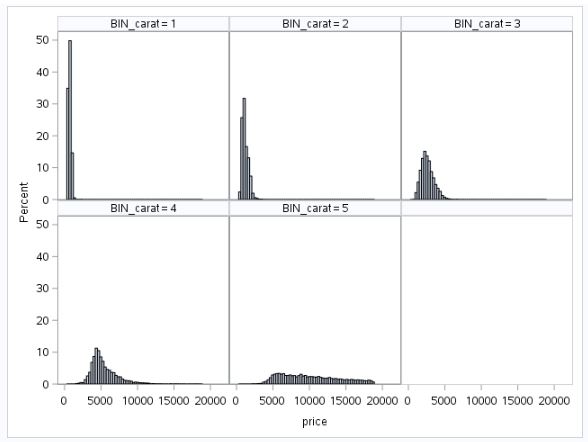
4.1 SGPANEL
PROC SGPANEL is very similar to PROC SGPLOT except that it optimizes the display of graphs you intend to show together in a panel.
ods graphics on;
proc sgpanel data=out;
    panelby BIN_carat;
    histogram price;
    format BIN_carat BIN_carat.;
run;
ods graphics off;
Here we use the panelby statement to create panels for each carat bin.
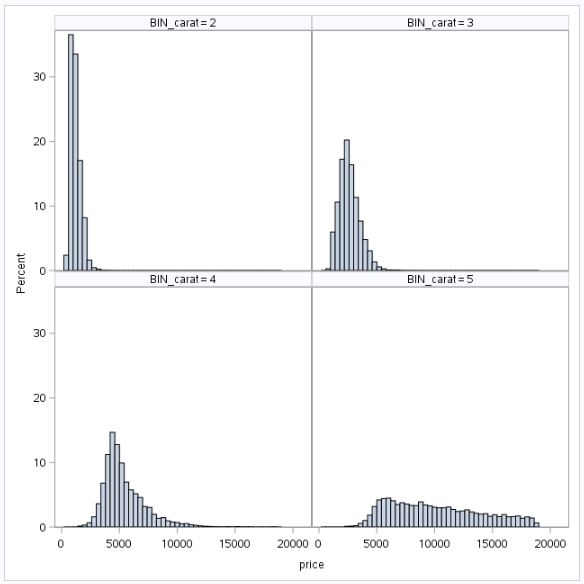
4.2 SGPANEL with WHERE
We can use a WHERE statement to use only a subset of the data. The WHERE statement is available in most procedures.
As shown in the panel above, it is difficult to understand the distribution for the first bin of data (i.e., the smallest carat diamonds). Therefore, the code below uses the WHERE statement to exclude the first bin.
ods graphics on;
proc sgpanel data=out;
    panelby BIN_carat / onepanel;
    histogram price;
    where BIN_carat in (2 3 4 5);
    format BIN_carat BIN_carat.;
run;
ods graphics off;
Here we use the where statement to only include the carat bins 2, 3, 4, 5.
This where statement will produce the same result:
where BIN_carat ^= 1;^= means “not equal to”. You can also use ne, short for “not equal”.
5 Creating subsetted data
If we were to focus our analysis on a data subset, it is far more efficient to conduct the analysis on a modified dataset rather than to constantly invoke the where statement.
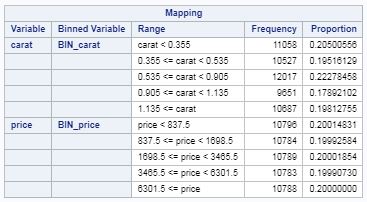
Imagine we want to do a focused analysis on diamonds with a BIN_carat of 3. First, we’ll use PROC HPBIN to output a dataset with most of the original variables from the diamonds dataset.
proc hpbin data=mrrlib.diamonds output=out
     numbin=5 quantile;
     input carat price;
     id carat price clarity color cut depth table;
run;
The binning results are shown below:
5.1 Subsetting with IF/THEN
IF/THEN logic is common to programming. SAS data steps support it, as shown in the IF/THEN statement below. We use the out dataset from the prior PROC HPBIN.
data temp_if;
set out;
if bin_carat ne 3 then delete;
run;
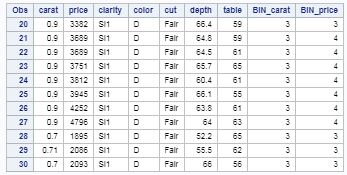
proc print data=temp_if(firstobs=20 obs=30); run;The code explained:
- We create a temporary dataset,
temp_if. - We start with
outas the dataset using thesetstatement. - If the variable bin-carat does not equal 3, then we delete the observation.
- With PROC PRINT, we use the options
firstobs=20 obs=30to print observations 20 through 30. Note thatobs>=firstobs.
5.2 Subsetting with WHERE
Using a WHERE statement to subset data is relatively more efficient than using an IF/THEN statement. The logic is applied before the dataset enters memory, whereas with IF/THEN, the dataset is first created and then the logic is applied.
data temp_where;
set out;
where bin_carat = 3;
run;
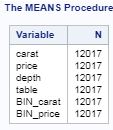
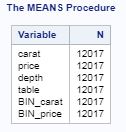
proc means data=temp_if N; run;
proc means data=temp_where N; run;The two PROC MEANS demonstrate that both methods of dataset creation produce the same number of observations.